Using putty/plink with PowerShell to SSH into an NSX Edge and collect information
This wiki article will explain how you can use Putty’s plink application to set up an SSH connection directly into a server that has the ssh server enabled to collect information and store it into a file so that this data is captured and if required can be analyzed later.
Use Case
The reason why I have written this is that I was doing some performance testing on the NSX Bare Metal Edge Servers of a customer. The information that is important for a performance test is to collect the interface throughput and the CPU usage of the Bare Metal Edge. This article will not go into the details of how the throughput test was set up, as I will only focus on collecting the data.
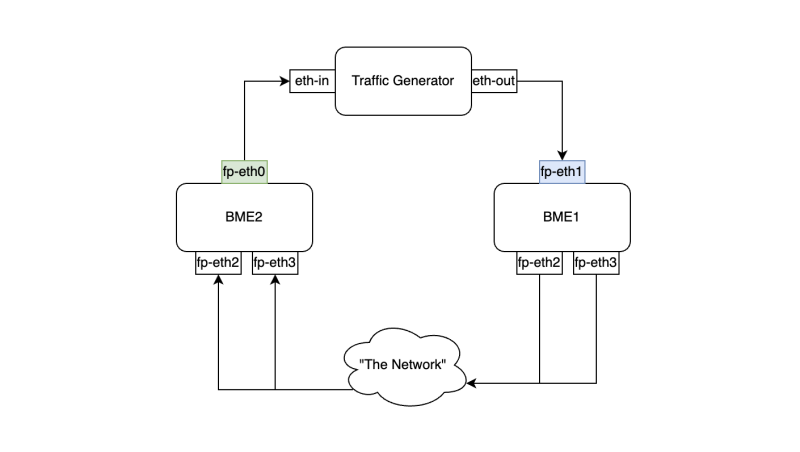
The only thing important to mention is that we have two Bare Metal Edges and we used one Bare Metal Edge (BME1) where the test traffic was entered, and the other Bare Metal Edge (BME2) where the test traffic was exiting.
The goal is to receive back the traffic (on eth-in) that is sent out by the Traffic Generator (on eth-out)
Obviously, there are more interfaces in “the network” on multiple network devices (switches, routers, ESXi hosts, and VMs) but this is out of scope as we are only focussing on the Bare Metal Edges in this article.
It is at the time of writing not possible to get the interface and CPU statistics of the NSX Bare Metal Edge from vRealize Operations (VROPS). So that is why I am using this workaround.
Commands / script
The commands on the Bare Metal Edge Server
The command on the Bare Metal Edge Servers to collect the interface statistics (throughput, etc.):
BME1> get dataplane throughput 5 json
{
  "bond-405133284": {
    "rx Gbps": 0.0,
    "rx K err/s": 0.0,
    "rx MB/s": 0.01,
    "rx k_err/s": 0.0,
    "rx k_miss/s": 0.0,
    "rx k_no_mbufs/s": 0.0,
    "rx kpps": 0.07,
    "tx Gbps": 0.0,
    "tx K drops/s": 0.0,
    "tx MB/s": 0.01,
    "tx kpps": 0.04
  },
  "fp-eth0": {
    "rx Gbps": 0.0,
    "rx K err/s": 0.0,
    "rx MB/s": 0.0,
    "rx k_err/s": 0.0,
    "rx k_miss/s": 0.0,
    "rx k_no_mbufs/s": 0.0,
    "rx kpps": 0.02,
    "tx Gbps": 0.0,
    "tx K drops/s": 0.0,
    "tx MB/s": 0.0,
    "tx kpps": 0.01
  },
  "fp-eth1": {
    "rx Gbps": 0.0,
    "rx K err/s": 0.0,
    "rx MB/s": 0.01,
    "rx k_err/s": 0.0,
    "rx k_miss/s": 0.0,
    "rx k_no_mbufs/s": 0.0,
    "rx kpps": 0.05,
    "tx Gbps": 0.0,
    "tx K drops/s": 0.0,
    "tx MB/s": 0.0,
    "tx kpps": 0.02
  },
  "fp-eth2": {
    "rx Gbps": 0.0,
    "rx K err/s": 0.0,
    "rx MB/s": 0.0,
    "rx k_err/s": 0.0,
    "rx k_miss/s": 0.0,
    "rx k_no_mbufs/s": 0.0,
    "rx kpps": 0.04,
    "tx Gbps": 0.0,
    "tx K drops/s": 0.0,
    "tx MB/s": 0.0,
    "tx kpps": 0.01
  },
  "fp-eth3": {
    "rx Gbps": 0.0,
    "rx K err/s": 0.0,
    "rx MB/s": 0.0,
    "rx k_err/s": 0.0,
    "rx k_miss/s": 0.0,
    "rx k_no_mbufs/s": 0.0,
    "rx kpps": 0.03,
    "tx Gbps": 0.0,
    "tx K drops/s": 0.0,
    "tx MB/s": 0.0,
    "tx kpps": 0.0
  }
}

BME1>
The command on the Bare Metal Edge Servers to collect the CPU Core usage statistics:
BME1> get dataplane cpu stats
CPU Usage
Core      : 0
Crypto    : 0 pps
Intercore : 0 pps
Kni       : 0 pps
Rx        : 80 pps
Slowpath  : 10 pps
Tx        : 10 pps
Usage     : 0%

Core      : 1
Crypto    : 0 pps
Intercore : 0 pps
Kni       : 0 pps
Rx        : 10 pps
Slowpath  : 10 pps
Tx        : 10 pps
Usage     : 0%

Core      : 2
Crypto    : 0 pps
Intercore : 0 pps
Kni       : 0 pps
Rx        : 0 pps
Slowpath  : 0 pps
Tx        : 0 pps
Usage     : 0%

Core      : 3
Crypto    : 0 pps
Intercore : 0 pps
Kni       : 0 pps
Rx        : 0 pps
Slowpath  : 0 pps
Tx        : 0 pps
Usage     : 0%

Core      : 4
Crypto    : 0 pps
Intercore : 0 pps
Kni       : 0 pps
Rx        : 0 pps
Slowpath  : 0 pps
Tx        : 0 pps
Usage     : 0%

Core      : 5
Crypto    : 0 pps
Intercore : 0 pps
Kni       : 0 pps
Rx        : 0 pps
Slowpath  : 0 pps
Tx        : 0 pps
Usage     : 0%

Core      : 6
Crypto    : 0 pps
Intercore : 0 pps
Kni       : 0 pps
Rx        : 0 pps
Slowpath  : 0 pps
Tx        : 0 pps
Usage     : 0%

Core      : 7
Crypto    : 0 pps
Intercore : 0 pps
Kni       : 0 pps
Rx        : 0 pps
Slowpath  : 0 pps
Tx        : 0 pps
Usage     : 0%

Core      : 8
Crypto    : 0 pps
Intercore : 0 pps
Kni       : 0 pps
Rx        : 0 pps
Slowpath  : 0 pps
Tx        : 0 pps
Usage     : 0%

Core      : 9
Crypto    : 0 pps
Intercore : 0 pps
Kni       : 0 pps
Rx        : 0 pps
Slowpath  : 0 pps
Tx        : 0 pps
Usage     : 0%

Core      : 10
Crypto    : 0 pps
Intercore : 0 pps
Kni       : 0 pps
Rx        : 0 pps
Slowpath  : 0 pps
Tx        : 0 pps
Usage     : 0%

Core      : 11
Crypto    : 0 pps
Intercore : 0 pps
Kni       : 0 pps
Rx        : 10 pps
Slowpath  : 0 pps
Tx        : 0 pps
Usage     : 0%

BME1>
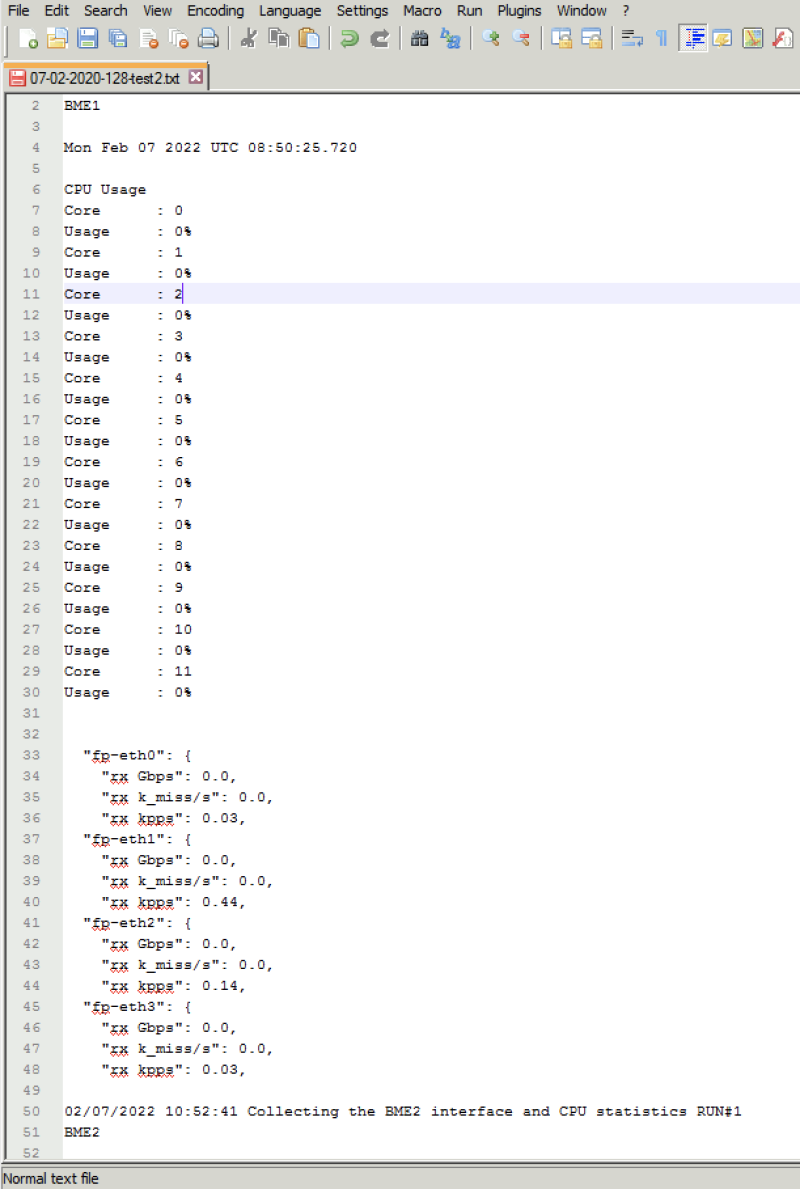
Collecting this information on multiple timeframes and copy/pasting this a separate text file across multiple Bare Metal Edges can be time-consuming and in the case of time-sensitive data collection, the momentum is easily lost.
To solve this issue the PowerShell script below where putty/plink is utilized can come in handy.
The PowerShell script 〈collect-troughput-cpu ps1〉
I am aware that by using more variables and loops, I could probably write the script much smarter. But I am not a professional scripter and this got the job done. If you can make it smarter contact me on LinkedIn.
You can find the script on my GitHub page.
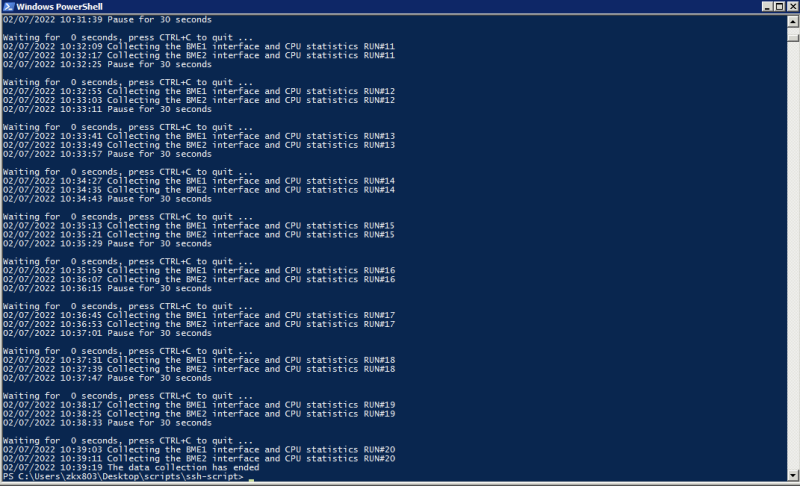
The interface and CPU collection are done in intervals of 30 seconds for a period of 10 minutes. This way you can compare the results for a longer period of time.
When you run the script the output should look something like this.


